Just these days I was wondering what exactly the coefficient of variability meant.Thanks for the information.
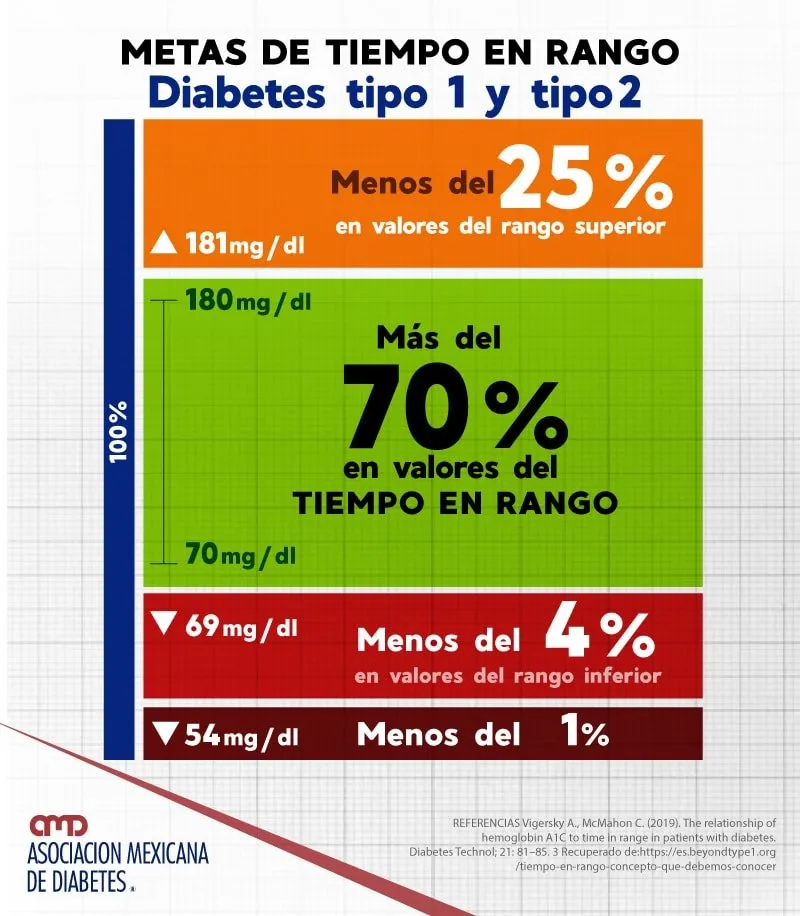
In my case I am 98% of the time in the range as average, 6.1% of A1C and 22.4% of glucose variability (which according to the objective of the application, I carry it well too)
I am quite happy with what I have improved thanks to the freestyle sensor.Before I thought I was doing well, but once you start knowing you and see how everything affects you (what you eat, the time you put before insulin, sport, be moving or sedentary after eating ... etc)It is when you really have good glucose control, avoiding any peak with food most of the time.
No signature configured, add it on your user's profile.
Isabelbota said:
@anaisabel
Hello.When you enter the web on the left there is like a phone and next to each other.You give that thing and you already get a screen where you put "glucose reports."You click there and the first thing is AGP where we are talking about.
I got the default data for 14 days, so in the upper right corner, in the three lines next to Libreview, I click and I already changed everything to 90 days.
It is true that we have a lot of information, but the information is never bad.What you have to give is the importance you have.This I looked at him as a curious thing, it is not essential either.As you say, it's about taking care and trying to do things right without obsessing, which we already have enough ... 😋😘
And where can you see the coefficient of variability?, Or do you have to calculate it?It is that I enter and I see the average glucose reports, hiccup events, but I can see that in the app, I would be interested in the coefficient.
No signature configured, add it on your user's profile.
In glucose report - AGP report you can see it
No signature configured, add it on your user's profile.
@meginer, in Libreview, on the first sheet click here:

The first sheet is the AGP report and you can choose if you want 7 days, 30 days, concrete dates, etc.

Time in rank is also seen in the sensor:

In my case, it reflects that I had many hypos while adapting my body to the new diet.
Lada enero 2015.
Uso Toujeo y Novorapid.
ruthbia said:
@meginer, in Libreview, on the first sheet click here:

The first sheet is the AGP report and you can choose if you want 7 days, 30 days, concrete dates, etc.

Time in rank is also seen in the sensor:

In my case, it reflects that I had many hypos while adapting my body to the new diet.
Thank you very much Ruthbia !!, I had not seen these reports, I only used the app.I am in coefficient of variability in 36.5, justify, with enough hypos in 15 D, to see if now with FIASP I am more stable.
No signature configured, add it on your user's profile.
ruthbia said:
@meginer, in Libreview, on the first sheet click here:

The first sheet is the AGP report and you can choose if you want 7 days, 30 days, concrete dates, etc.

Time in rank is also seen in the sensor:

In my case, it reflects that I had many hypos while adapting my body to the new diet.
How do I do if I want to see the AGP report of the last week?, By default is for 14 D, change it above and give AGP report and continue giving me the last 14 d.
No signature configured, add it on your user's profile.
evacf
08/15/2021 9:26 a.m.
I looked what were the data for a person without diabetes.For it, variation variability is usually 20% and average glycemia over 100. In case someone is interested.
No signature configured, add it on your user's profile.
Thank you very much Ruthbia for the information.
It is very good for me to better understand the results that Glucosa reports from Libreview give.
No signature configured, add it on your user's profile.
@meginer in report configuration

Then you give here: a week are the last 7 days

Lada enero 2015.
Uso Toujeo y Novorapid.


