Hello everyone.
Today I got in Libreview because I have been registering everything possible in LibreLink and I wanted to see how the annotations come out in Libreview, but I don't know how to go.
In reports I have given you a daily registration but eg does not come out today, it leaves for weeks, it cuts me on March 21.
Is that so?
How do you see everything you aim daily?
Thank you.
No signature configured, add it on your user's profile.
@meginer
It only shows graphics per weeks, not for days.
For days it is seen in the glucometer or in the app.
You can download the Excel with all the measurements and make you the graphs.
Lada enero 2015.
Uso Toujeo y Novorapid.
meginer said:
hello everyone.
Today I got in Libreview because I have been registering everything possible in LibreLink and I wanted to see how the annotations come out in Libreview, but I don't know how to go.In reports I have given you a daily registration but eg does not come out today, it leaves for weeks, it cuts me on March 21.Is so?How do you see everything you aim daily?Thank you.
All information appears in a daily registry.

Db1 desde Diciembre 2007.
Fiasp y Tresiba.
FreeStyle Libre 2
Yes, in daily registration, you get the graph of the day with the annotations you have introduced in LibreLink
No signature configured, add it on your user's profile.
Josemibi said:
meginer said:
hello everyone.
Today I got in Libreview because I have been registering everything possible in LibreLink and I wanted to see how the annotations come out in Libreview, but I don't know how to go.In reports I have given you a daily registration but eg does not come out today, it leaves for weeks, it cuts me on March 21.Is so?How do you see everything you aim daily?Thank you.
All information appears in a daily registry.

But you only get that day what do you have?I mean that if I point things today, if I can see them today, I can only see them until March 22, that is, just a week ago.I give him a daily registration and I am passing the letters vertically, and the most I see is the curve with the records of last week.
No signature configured, add it on your user's profile.
@meginer, lets you see up to 90 days behind, but of course you have to change it
No signature configured, add it on your user's profile.
Go to report configuration and there you change it.
No signature configured, add it on your user's profile.
Thank you all, if I tell you what happened to me, you hit me a colleja, hehe, that the pq pages was not happening from my mobile and I did not see that there were more pages !!!!
No signature configured, add it on your user's profile.
I am only worth the AGP report, I am worth the Diabox control values, so now Diabox presented to the endocrine.
He forgot to pass the mobile almost always.
Reviewing LibreView I found this in the legend:
* Strip test

Are you thinking of updating the app to introduce capillary measures? ... that paints ... how do you see it?
Lada enero 2015.
Uso Toujeo y Novorapid.
Hello.
Can you inform me because the freeview, only collects the data until 08/26/2024 ??
Today in the visit with the endocrine, we have also been able to visualize until 08/26/2024, and not until today.
Do you know if there is any problem in the system?

No signature configured, add it on your user's profile.
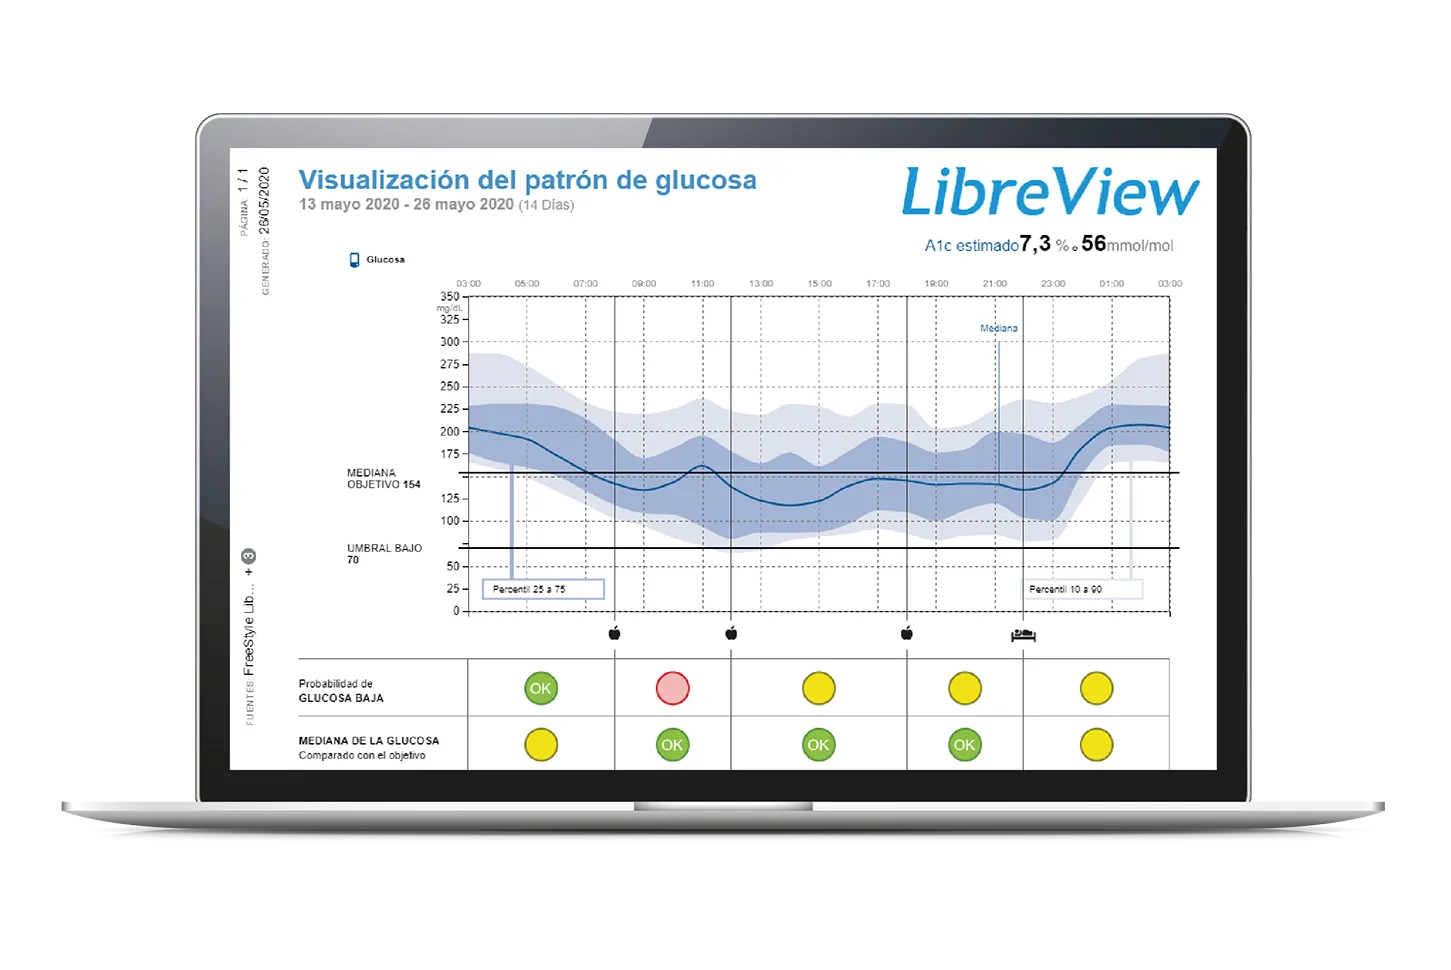
Can you inform me how to interpret this data? I measure them with mobile and sensor, I check them and I can't find a way to interpret.
No signature configured, add it on your user's profile.
I do the diabox graphics in Excel, you can get the same as freeview with formulas.
Lada enero 2015.
Uso Toujeo y Novorapid.
jordiv said:
Can you inform me how to interpret this data? I measure them with mobile and sensor, I check them and I can't find the way to interpret.
That is the one day data, it puts the minimum and maximum value at that time
Lada enero 2015.
Uso Toujeo y Novorapid.
ruthbia said:
jordiv said:
can you inform me how to interpret this data?, I measure them with mobile and sensor, I check them and I do not find the formto interpret.
That is the one day data, it puts the minimum and maximum value at that time
I do not understand why it puts me in the minimum, the registered real glucose, and in the maximum I do not know where it takes it, it is usually higher, and that without having registered it.
No signature configured, add it on your user's profile.
The minimum I understand, since it is the one that I have controlled with the mobile and sensor, but the maximum, no idea
No signature configured, add it on your user's profile.


